Login


HR Operations Specialist Salary in India



PRODUCTS
 Payroll Suite
 HR Suite
 Talent Suite
 Project Services Suite
Meet the platform tailored to your business
Core system of record
One platform for the entire employee journey
How Srijan Technologies streamlined timesheets management with Keka
Read customer story
Anarock replaces fragmented HR processes with one platform for 2,500+ employees
Read the story
BY INDUSTRY
BY COMPANY SIZE
LEARN
EXPLORE KEKA
Navigate every labor law, wage regulation, and statutory requirement across all 28 states and 8 union territories without the legal headaches.
Learn More
HR Operations Specialist salaries in India range from ₹10 LPA to ₹1.6 Cr in 2026, depending on experience, industry, and location. This guide breaks down HR Ops salary benchmarks from associate to Head roles, highlighting top-paying sectors like Hi-Tech and BFSI. Discover how HRIS expertise, payroll automation, and shared services leadership can drive 10–25% premiums and long-term career growth.
Five years ago, HR Operations was considered back-office work.
Today, it’s the operational backbone of every scaling organization, managing payroll systems, HRIS platforms, compliance frameworks, and employee data that directly impact business continuity and employee experience.
Despite this shift, compensation for HR Operations specialists still varies widely. Many professionals remain unsure whether they’re being paid fairly for the strategic operational impact they now deliver.
This is starting to change.
Insights from the HR Salary Benchmarking Report 2026 show a visible shift in how HR roles are valued in India, especially operational functions tied to business continuity and employee experience.
While the report looks at multiple HR functions, this guide focuses only on HR Operations specialist salaries in India.
Salary progression in HR Operations depends less on tenure and more on scope of responsibility.
Median compensation grows roughly 3.5x from Manager to Head roles, making leadership transitions the most significant inflection point in the HR Ops career path.
HR Operations Salary Overview: Entry to Leadership
| Role Level | Experience | Median CTC | P25 | P75 | P90 |
| HR Shared Services Associate | 0–2 years | ₹10.5 LPA | ₹8.4 LPA | ₹12.6 LPA | ₹14.7 LPA |
| HR Shared Services Specialist | 2–5 years | ₹18.5 LPA | ₹14 LPA | ₹22 LPA | ₹26 LPA |
| HR Shared Services Manager | 5–8 years | ₹25.5 LPA | ₹20 LPA | ₹30 LPA | ₹36 LPA |
| Senior Manager Shared Services | 8–12 years | ₹35.5 LPA | ₹28 LPA | ₹42 LPA | ₹50 LPA |
| BU/GEO Shared Services Lead | 10–15 years | ₹51.5 LPA | ₹40 LPA | ₹60 LPA | ₹70 LPA |
| Director HR Shared Services | 12–18 years | ₹75 LPA | ₹60 LPA | ₹90 LPA | ₹110 LPA |
| Head of HR Shared Services | 15+ years | ₹115 LPA | ₹95 LPA | ₹135 LPA | ₹160 LPA |
Freshers enter HR Operations through roles focused on execution and system exposure.
Most people start as HR Shared Services Associates or Junior HR Ops Executives, handling payroll inputs, employee data maintenance, documentation support, onboarding coordination, and routine employee queries.
From a compensation standpoint, fresher HR Operations roles sit between ₹8 LPA and ₹14 LPA. GCC hubs and metro cities pay at the higher end due to technology exposure and operational scale
This is where HR Operations professionals stop just executing and start owning outcomes.
Common roles include HR Shared Services Specialist and HR Operations Manager. The focus shifts to managing complete payroll cycles, maintaining HRIS platform accuracy, ensuring compliance across statutory requirements, coordinating with vendors and IT teams, and driving process improvements.
Compensation typically ranges from ₹18–36 LPA. Tech-driven industries like Hi-Tech and BFSI pay at the higher end, while traditional sectors with less automation investment stay closer to the median.
Did You Know?
The difference between an ₹18 LPA specialist maintaining existing processes and a ₹30 LPA manager driving automation projects reflects the shift from operational execution to strategic contribution.
At senior levels, HR Operations becomes a strategic function tied directly to business scalability.
Roles at this stage include Senior Manager Shared Services, BU/GEO Shared Services Lead, Director HR Shared Services, and Head of HR Shared Services. Compensations range from ₹35 LPA to ₹1.6 Cr depending on organizational scale, geographic coverage, and transformation accountability.
But experience alone doesn’t determine compensation ceiling. Industry choice plays an equally critical role. Two HR Operations professionals with identical experience can earn vastly different salaries based solely on the sector they work in and the operational complexity they manage.
HR Operations compensation in India varies by industry. The differences are largely shaped by how complex the operational environment is, how strict compliance requirements are, and how deeply organizations have invested in HR technology and shared services models.
Industries that operate at scale, manage distributed workforces, or rely heavily on automation tend to offer higher compensation. Sectors where processes remain standardized or manual typically show lower salary ranges.
Industry-Wise HR Operations Salary Comparison
| Role | All Industries | Hi-Tech | BFSI | Manufacturing | Healthcare | Retail | BPO/GBS |
| Head | ₹115 LPA | ₹140 LPA (+22%) | ₹133 LPA (+16%) | ₹109 LPA (-5%) | ₹115 LPA (0%) | ₹109 LPA (-5%) | ₹115 LPA (0%) |
| Director | ₹75 LPA | ₹90 LPA (+20%) | ₹87 LPA (+16%) | ₹71 LPA (-5%) | ₹79 LPA (+5%) | ₹71 LPA (-5%) | ₹70 LPA (-7%) |
| Specialist | ₹18.5 LPA | ₹22 LPA (+19%) | ₹21 LPA (+14%) | ₹17 LPA (-8%) | ₹19 LPA (+3%) | ₹17 LPA (-8%) | ₹20 LPA (+8%) |
Median salaries are up 10–12% YoY, backed by enterprise HR transformation programs. Three structural patterns define this function: the Manager-to-Head uplift is ~3.5×, the P25–P75 spread is tighter than most HR roles due to process uniformity, and career growth is horizontal — systems and tools depth beats title progression on salary.
Technology organizations continue to lead HR Operations compensation across levels. Specialist roles in Hi-Tech average ₹22 LPA compared to the overall median of ₹18.5 LPA, while Director roles rise to ₹90 LPA versus the market median of ₹75 LPA. At leadership levels, Heads of HR Shared Services in technology companies reach ₹140 LPA, representing a premium of more than ₹25 LPA over the all-industry benchmark.
This premium reflects the complexity of managing multi-platform HRIS ecosystems, global workforce structures, automation programs, and equity-linked compensation models.
The BFSI sector follows closely, offering consistent salary premiums across levels. Specialists earn around ₹21 LPA (+14%) compared to ₹18.5 LPA overall, and Director roles reach ₹87 LPA (+16%) versus ₹75 LPA in the broader market. Leadership compensation for Heads of HR Shared Services stands at ₹133 LPA (+16%).
These increases are tied to regulatory oversight, complex payroll structures, statutory compliance requirements, and the operational risk associated with payroll accuracy and reporting.
Healthcare maintains near-median compensation, with specialist roles averaging ₹19 LPA (+3%) and Director roles around ₹79 LPA (+5%), and Heads flat at ₹115 LPA, matching the all-industry benchmark exactly.
This reflects the sector’s structured compliance environment and growing need for workforce coordination, though operational complexity remains slightly lower than in Hi-Tech or BFSI.
Manufacturing and retail typically fall below market benchmarks. Specialist roles in these industries average ₹17 LPA (-8%) compared to ₹18.5 LPA overall, and Director compensation ranges around ₹71 LPA (-5%) versus the ₹75 LPA market median. Leadership salaries also trend lower, with Heads averaging ₹109 LPA (-5%) compared to ₹115 LPA across industries.
The gap is largely driven by standardized processes, slower technology adoption, and more localized workforce structures.
BPO and Global Business Services environments present a different pattern. Specialist roles average ₹20 LPA (+8%), slightly above the all-industry median of ₹18.5 LPA due to high transaction volumes and mature shared services frameworks.
However, Director roles tend to align slightly below market levels at ₹70 LPA (-7%) compared to ₹75 LPA overall, as operational efficiency forms the core business capability and limits compensation differentiation at leadership levels.
Location continues to shape compensation, although hybrid work and the decentralization of shared services have gradually reduced its impact.
Table: City-Wise HR Operations Salary Benchmarks
| City | Head Median | Specialist Median | Associate Median | Premium vs India Median |
| Bangalore | ₹1.44 Cr | ₹23 LPA | ₹14 LPA | +25–33% |
| Mumbai | ₹1.36 Cr | ₹21 LPA | ₹12 LPA | +14–18% |
| Hyderabad | ₹1.29 Cr | ₹20 LPA | ₹13.4 LPA | +8–28% |
| Delhi NCR | ₹1.29 Cr | ₹20 LPA | ₹11.4 LPA | +8–12% |
| Pune | ₹1.27 Cr | ₹20 LPA | ₹11.3 LPA | +8–10% |
| Chennai | ₹1.21 Cr | ₹19 LPA | ₹8.5 LPA | +3–5% |
| Tier II Cities | ₹1.04 Cr | ₹16 LPA | ₹8 LPA | −10–24% |
Bangalore and Mumbai continue to lead HR Operations compensation across all levels. The dense concentration of GCCs, global payroll operations, and enterprise automation initiatives drives sustained demand for experienced professionals, pushing premiums to 25–33% above the national median in Bangalore and 14–18% above in Mumbai. Leadership roles in metros can outpace national averages by ₹20–30 LPA, with specialist roles commanding an additional ₹3–5 LPA premium.
Hyderabad, Delhi NCR, Pune, and Chennai offer competitive compensation, typically ranging from +8% to +12% above national medians for mid and senior roles. Hyderabad stands out at the associate level with a notably higher premium of +28%, reflecting strong GCC-driven demand for early-career HR Operations talent.
Growth across these cities is supported by enterprise expansion and the ongoing decentralization of shared services operations, though leadership premiums remain slightly below metro benchmarks.
Tier-II markets show salary normalization that deepens with seniority, with compensation running 10–15% below national medians at mid and senior levels and up to 20–24% lower at entry level. Large, shared services operations remain limited in these ecosystems, constraining both senior role availability and pay growth.
Key takeaway: Location carries more weight as HR Operations roles become more strategic, metro advantage grows with seniority, while Tier-II impact is most pronounced at the associate and specialist levels.
HR Operations salaries in India are influenced by four primary factors: location, experience, skills, and industry exposure.
Compensation increases as professionals move from transactional roles into system ownership, automation leadership, and enterprise service delivery.
It plays a major role in salary variation. GCC hubs such as Bangalore, Hyderabad, and Pune command higher compensation due to scale, technology adoption, and demand for shared services talent. Tier II cities typically remain about 10% below national medians, though the gap is gradually narrowing as HR shared services decentralize.
Entry-level roles focus on transactional delivery, while senior positions lead digital transformation, process optimization, and cross-geography service models
They are among the strongest salary drivers. Expertise in HRIS platforms, payroll automation, RPA, and analytics accelerates progression and increases earning potential as organizations shift toward technology-enabled HR service delivery.
Hi-Tech, BFSI, and large shared services environments typically pay 15–25% above market medians due to higher compliance requirements, transaction complexity, and digital maturity, while manufacturing and retail sectors tend to offer lower salary benchmarks.
Overall, salary growth in HR Operations is determined by how effectively professionals combine these factors, location, experience, skills, and industry context, rather than experience alone.
Career progression in HR Operations follows a structured, step-by-step path shaped by scale of responsibility, technology adoption, and transformation exposure.
The journey moves from transactional execution to enterprise HR service leadership, with compensation expanding as professionals move from process support to strategic enablement roles.
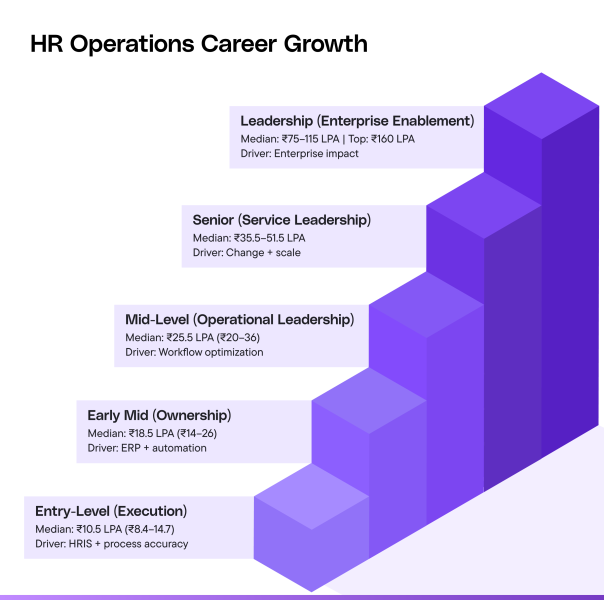
At the start of the career, HR Operations roles focus on accurate and efficient service delivery. Professionals manage payroll inputs, employee data, documentation, onboarding support, and compliance processes.
Typical compensation at this stage:
Growth is driven by process reliability, exposure to HRIS systems, and familiarity with shared services operations. Professionals who gain early experience with HR platforms and analytics tools tend to progress faster.
As professionals transition into Specialist roles, responsibilities expand into system ownership and operational problem-solving. This stage involves payroll cycle management, HRIS maintenance, compliance reporting, and vendor coordination.
Compensation reflects this shift in accountability:
The report notes that skills in HRIS platforms, ERP systems, and automation tools significantly accelerate career progression at this stage.
Manager roles mark the transition from system ownership to operational leadership. Professionals manage service delivery, oversee process improvements, and drive efficiency initiatives.
Salary benchmarks at this stage include:
Career growth is driven by the ability to improve workflows, implement automation, and manage service performance across team.
Senior roles focus on governance, automation adoption, and regional operations management. Professionals lead shared services frameworks, manage SLAs, and scale operational models.
Compensation expands accordingly:
At this stage, leadership capability, change management, and multi-region coordination become key growth drivers
Leadership roles are centred on transformation and enterprise service design. Professionals define technology roadmaps, manage global delivery frameworks, and align HR Operations with business strategy.
Salary benchmarks reflect this scale:
The report highlights that compensation growth at this stage is driven less by specialization and more by scope, span of control, and transformation responsibility. Median salaries across HR Operations have grown 10–12% year-on-year, fueled by HR transformation programs and shared services expansion
HR Operations has evolved far beyond an administrative support function. Today, it stands as a core business pillar that directly influences efficiency, compliance, employee experience, and organizational scalability.
Sitting at the intersection of people, process, and technology, HR Operations has become one of the most stable and scalable career tracks within HR. As organizations continue to digitize workflows and optimize internal systems, the demand for professionals who can streamline processes and drive operational excellence is only increasing.
Those who invest in HR systems expertise, automation capabilities, data fluency, and strategic service design are positioned to see the strongest salary growth over the coming years. Mastery of HR tech stacks, analytics-driven decision-making, and process transformation will differentiate high earners from the rest.
For professionals evaluating long-term HR career paths, HR Operations offers something uniquely compelling: predictable progression, measurable business impact, cross-functional visibility, and growing strategic relevance in modern, tech-enabled organizations.
The average HR Operations Specialist salary in India is around ₹18.5 LPA at the median, typically ranging between ₹14-26 LPA depending on skills, industry, and city. Freshers start near ₹10.5 LPA, while experienced specialists and leads can progress towards ₹28-35+ LPA with the right exposure.
Bangalore offers the strongest salaries, with entry roles paying up to 33% more than the all-India median and Head roles touching ₹144 LPA. Hyderabad, Mumbai, and Delhi NCR also provide strong premiums, while Tier II cities lag 10-24% but are gradually catching up as HR shared services decentralize.
Specialists can improve earning potential by buildingexpertise in HRIS platforms, payroll automation, RPA, and HR analytics, which attract 8-35% premiums in BFSI and IT hubs. Moving into Hi-Tech or GCC environments, taking on multi-region scope, and demonstrating measurable process improvements also accelerate promotions and compensation growth.
Senior Managers in HR Operations typically earn ₹28-50 LPA, with a median of around ₹35.5 LPA. Director roles cluster near ₹75 LPA (₹60-110 LPA range), while Heads of HR Shared Services can reach ₹95-160 LPA, especially when leading large, multi-country payroll and compliance transformations.
Subscribe to keep up with the latest strategic finance content.
Request a demo