Login


Compa Ratio: How to Calculate It, and Why It Matters



PRODUCTS
 Payroll Suite
 HR Suite
 Talent Suite
 Project Services Suite

Meet the platform tailored to your business
Core system of record
One platform for the entire employee journey

BY INDUSTRY
BY COMPANY SIZE
LEARN
EXPLORE KEKA
Compa ratio shows how much an employee is paid compared to the middle of their salary range. This helps companies see which jobs are paid little or not in line with the market. Before people leave the company this tool can help find those issues. Compa ratio connects how much people are paid with hiring decisions reviews of work, promotions and making pay is fair. This guide explains the formula, how to do the math, in Excel ways to use it and what to do after you get the results.
One of the most effective tools to evaluate whether employee pay aligns with market value is the Compa Ratio, short for comparative ratio. This simple yet powerful metric allows HR teams and managers to determine how an employee’s salary compares to the midpoint of a given salary range for their role.
Whether you’re trying to ensure equity, support high performers, or maintain budget control, understanding the meaning of compa ratio helps make smarter, data-driven decisions about pay.
As Matt Schulman highlighted in a LinkedIn post, too many companies treat compa ratios as an afterthought, something to check only when engagement drops or attrition looms. But the smartest organizations use compa data proactively, as an early warning system to spot pay disparities before they turn into deeper issues.
This article will give you everything you need to know about the compa ratio, so you can start calculating it and make compensation adjustments at the right time.
A Compa Ratio (short for compensation ratio) is a metric used to assess how an employee’s salary compares to the midpoint of a defined salary range for their role. It is calculated by dividing the employee’s current salary by the midpoint of the salary range.
This simple yet powerful indicator helps HR teams understand pay competitiveness and maintain internal pay equity.
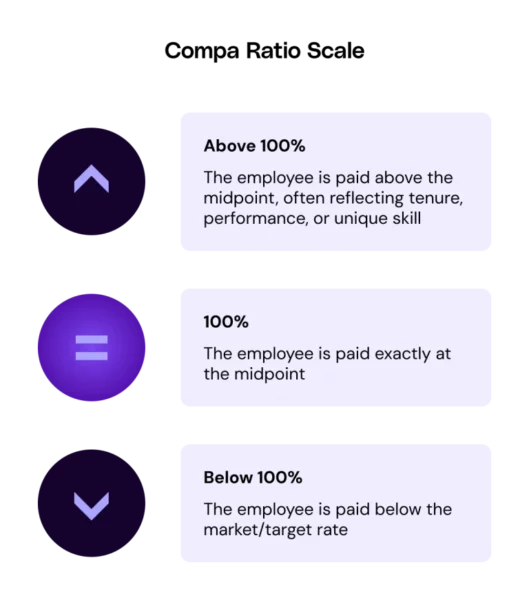
A compa ratio of:
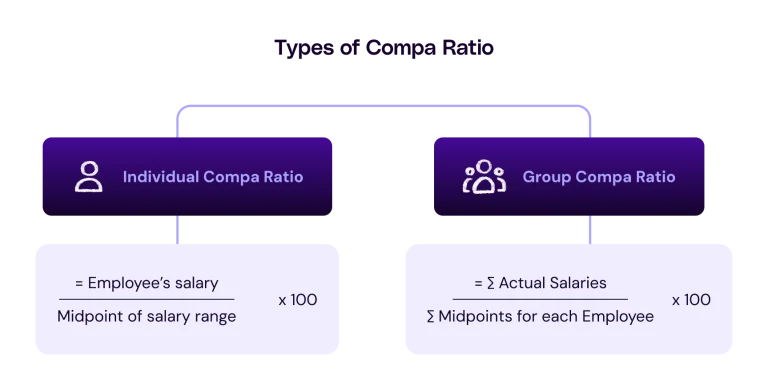
The Individual Compa Ratio is a measurement that compares an employee’s current salary to the midpoint of their salary range (usually the market or internal benchmark for their job grade).
The Group Compa Ratio evaluates the average compensation of a team, department, job family, or entire organization compared to the average of their respective salary range midpoints.
| Dimension | Compa Ratio | Range Penetration |
| Measures | Salary relative to the midpoint | Salary position within the entire range |
| Focus | Market competitiveness | Internal career progression |
| Use cases | Pay equity, market alignment, merit increase justification | Career mapping, succession planning, and pay ceiling awareness |
| Formula | Salary ÷ Midpoint × 100 | (Salary − Minimum) ÷ (Maximum − Minimum) × 100 |
| Ideal for | HRBP, Total Rewards, Compensation Planning | L&D, HRBP, Career Pathing Programs |
| Visual insight | Are you aligned with the market benchmark? | How far along are you within your current band? |
| Influences | External market data, internal salary range midpoints | Internal range design, tenure, performance trajectory |
| When to use | During compensation reviews, salary benchmarking, or to detect pay disparities | During career development discussions, identifying promotion readiness, or flagging pay stagnation |
To calculate a compa ratio accurately, it’s essential to understand the key components that go into the formula.
Each element plays a specific role in determining whether an employee’s compensation is in line with internal policies and market benchmarks.
This is the current base salary of the employee, usually calculated on an annual basis. It excludes bonuses, stock options, or other variable pay components. This figure reflects what the employee is currently earning in their role.
The salary midpoint is the center point of the salary range for a given position. It’s often defined through a combination of:
The midpoint represents the ideal or competitive salary for that specific job. Employees with average performance or tenure are typically expected to fall near this value.
Once you have the employee’s actual salary and the salary midpoint, the compa ratio is calculated using the above formula.
It may be expressed as:
Let’s take the case of Sarah, a software engineer at TechCo.
Sarah’s Current Salary: $60,000
Salary Midpoint for Role: $70,000
Compa ratio = 60,000/70,000 *100 = 85.7%
This means Sarah is earning 85.7% of the midpoint, which could indicate she’s slightly underpaid relative to the role’s standard.
Calculating compa ratio in Excel is simple and efficient. Use the formula:
= (Actual_Salary / Midpoint_Salary) * 100
For example, if the employee’s current salary is in cell A2 and the midpoint salary is in B2, enter the following formula in C2:
= (A2 / B2) * 100
The compa ratio is a strategic HR tool that empowers organizations to make data-driven decisions around pay equity, competitiveness, and performance recognition.
Compa ratio helps benchmark internal salaries against external market rates, ensuring that compensation structures remain competitive. When organizations aim to attract and retain top talent, offering pay that aligns with industry standards becomes crucial. A low compa ratio may signal that an employee is underpaid compared to the market, potentially leading to dissatisfaction or turnover.
During salary reviews, the compa ratio acts as a reference point to assess whether employees are being paid appropriately based on their role and experience. It helps identify:
Compa ratio is a decision-making aid when considering salary adjustments for promotions or performance-based raises. It ensures consistency by evaluating where an employee currently stands within the pay range before making changes.
Compa ratio analysis is a powerful tool in pay equity audits. By examining compa ratios across different demographic groups (e.g., gender, race, age), HR teams can detect systemic inequalities in pay and take corrective action.
It’s a key component in promoting diversity, equity, and inclusion (DEI) initiatives and ensuring compliance with regulations.
| Compa Ratio Value | Interpretation | Where It’s Utilized |
| < 0.80 | Employee is paid significantly below the market or midpoint. May indicate new hires, performance issues, or possible pay equity concerns. | – Salary review cycles to flag underpaid employees – DEI audits for pay disparity detection |
| 0.80 – 1.00 | Employee is paid below the at-market/midpoint. Often appropriate for less experienced or developing employees. | – Entry-level compensation planning – Performance-based pay progression frameworks |
| 1.00 | Employee is paid exactly at the market/midpoint. Reflects fair, competitive pay for competent employees. | – Benchmarking for internal pay structure alignment – Standard for compensation equity |
| 1.00 – 1.20 | Employee is paid above market/midpoint. May reflect high performance, seniority, or critical skills. | – Strategic talent retention plans – Promotions and raise evaluations |
| > 1.20 | Employee is paid significantly above market/midpoint. Could indicate compression, overpayment, or need for pay structure reevaluation. | – Salary structure audits – Executive compensation planning – Pay compression analysis |
Conducting pay equity audits and aligning compensation with performance can be complex, but it doesn’t have to be.
With Keka, you get a modern, employee-centric HR platform that simplifies:
To calculate a compa ratio in MS Excel, you can use the formula =(A2/B2)*100, where A2 contains the employee’s current salary and B2 contains the market or pay-grade midpoint. The formula divides the salary by the midpoint, multiplies the result by 100 to express it as a percentage, showing how the employee’s pay compares to the benchmark.
If an employee’s compa ratio is below 100%, it means their salary is lower than the market or pay-grade midpoint for their role. This could indicate potential underpayment, particularly if the employee is performing well or exceeding expectations. It may suggest the need for a salary review to ensure fairness, competitiveness, and retention of top talent.
A good compa ratio for employees generally falls between 90% and 110%, depending on factors like experience, performance, and tenure. Ratios close to 100% indicate strong alignment with market pay, while those slightly above or below can be acceptable if justified by skills, responsibilities, or growth potential within the organization’s compensation philosophy.
HR should review compa ratios at least once or twice annually, ideally ahead of performance reviews or compensation planning. Consistent monitoring helps spot pay gaps early, maintain market competitiveness, and ensure equitable, data-driven salary decisions that align employee compensation with both organizational objectives and changing market conditions.
Yes. By comparing compa ratios of employees in similar roles, organizations can identify potential pay disparities related to gender, race, tenure, or other factors. This makes the compa ratio a valuable tool for equity audits, helping HR uncover hidden gaps, promote fairness, and ensure compensation practices support diversity, inclusion, and compliance with equal pay standards.
If an employee’s compa ratio is too low, HR should review their performance, tenure, and market data to determine if a salary adjustment, promotion, or role reclassification is needed. If it’s too high, assess whether the role is misaligned, the pay range needs updating, or the employee’s skills and responsibilities have exceeded current benchmarks.
Subscribe to keep up with the latest strategic finance content.
Request a demo